新用户扫码下载


扫码下载APP
及时接收考试资讯及
备考信息

Example 1
Beta Co produces 3 products, E, F and G, details of which are shown below:

There are 320,000 bottleneck hours available each month.
Required:
Calculate the optimum product mix each month.
Answer
A few simple steps can be followed:
1. Calculate the throughput per unit for each product.
2. Calculate the throughput return per hour of bottleneck resource.
3. Rank the products in order of the priority in which they should be produced, starting with the product that generates the highest return per hour first.
4. Calculate the optimum production plan, allocating the bottleneck resource to each one in order, being sure not to exceed the maximum demand for any of the products.
It is worth noting here that you often see another step carried out between Steps 2 and 3 above. This is the calculation of the throughput accounting ratio for each product. Thus far, ratios have not been discussed, and while I am planning on mentioning them later, I have never seen the point of inserting this extra step in when working out the optimum production plan. The ranking of the products using the return per factory hour will always produce the same ranking as that produced using the throughput accounting ratio, so it doesn’t really matter whether you use the return or the ratio.
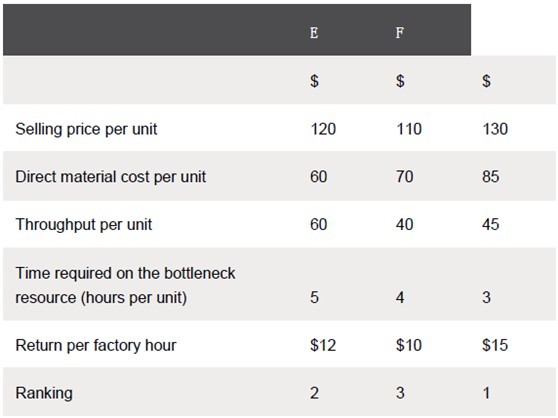
It is worth noting that, before the time taken on the bottleneck resource was taken into account, product E appeared to be the most profitable because it generated the highest throughput per unit. However, applying the theory of constraints, the system’s bottleneck must be exploited by using it to produce the products that maximise throughput per hour first (Step 2 of the five focusing steps). This means that product G should be produced in priority to E.
In practice, Step 3 will be followed by making sure that the optimum production plan is adhered to throughout the whole system, with no machine making more units than can be absorbed by the bottleneck, and sticking to the priorities decided.
When answering a question like this in an exam it is useful to draw up a small table, like the one shown below. This means that the marker can follow your logic and award all possible marks, even if you have made an error along the way.

Each time you allocate time on the bottleneck resource to a product, you have to ask yourself how many hours you still have available. In this example, there were enough hours to produce the full quota for G and E. However, when you got to F, you could see that out of the 320,000 hours available, 270,000 had been used up (120,000 + 150,000), leaving only 50,000 hours spare.
Therefore, the number of units of F that could be produced was a balancing figure – 50,000 hours divided by the four hours each unit requires – ie 12,500 units.
The above example concentrates on Steps 2 and 3 of the five focusing steps. I now want to look at an example of the application of Steps 4 and 5. I have kept it simple by assuming that the organisation only makes one product, as it is the principle that is important here, rather than the numbers. The example also demonstrates once again how to identify the bottleneck resource (Step 1) and then shows how a bottleneck may be elevated, but will then be replaced by another. It also shows that it may not always be financially viable to elevate a bottleneck.
Example 2
Cat Co makes a product using three machines – X, Y and Z. The capacity of each machine is as follows:

The demand for the product is 1,000 units per week. For every additional unit sold per week, net present value increases by $50,000. Cat Co is considering the following possible purchases (they are not mutually exclusive):
Purchase 1 Replace machine X with a newer model. This will increase capacity to 1,100 units per week and costs $6m.
Purchase 2 Invest in a second machine Y, increasing capacity by 550 units per week. The cost of this machine would be $6.8m.
Purchase 3 Upgrade machine Z at a cost of $7.5m, thereby increasing capacity to 1,050 units.
Required: Which is Cat Co’s best course of action?
Answer
First, it is necessary to identify the system’s bottleneck resource. Clearly, this is machine Z, which only has the capacity to produce 500 units per week. Purchase 3 is therefore the starting point when considering the logical choices that face Cat Co. It would never be logical to consider either Purchase 1 or 2 in isolation because of the fact that neither machines X nor machine Y is the starting bottleneck. Let’s have a look at how the capacity of the business increases with the choices that are available to it.
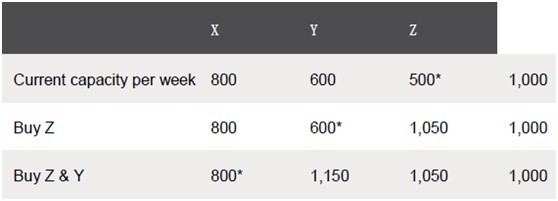

From the table above, it can be seen that once a bottleneck is elevated, it is then replaced by another bottleneck until ultimately market demand constrains production. At this point, it would be necessary to look beyond production and consider how to increase market demand by, for example, increasing advertising of the product.
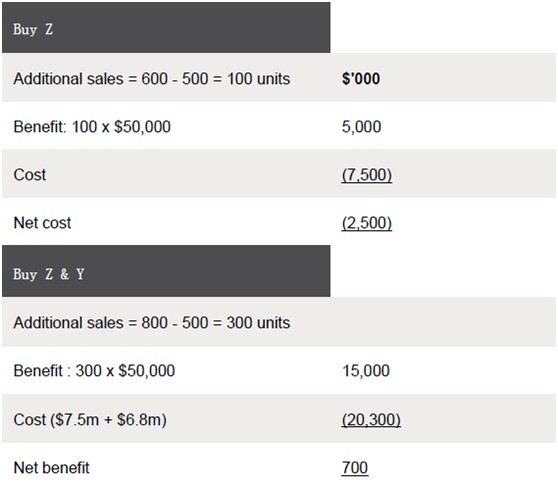
In order to make a decision as to which of the machines should be purchased, if any, the financial viability of the three options should be calculated.
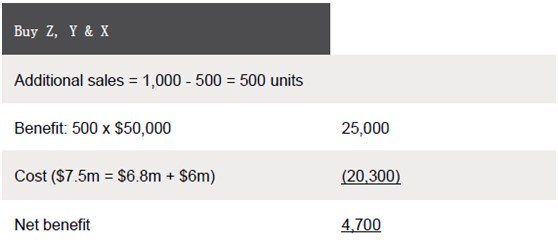
The company should therefore invest in all three machines if it has enough cash to do so.
The example of Cat Co demonstrates the fact that, as one bottleneck is elevated, another one appears. It also shows that elevating a bottleneck is not always financially viable. If Cat Co was only able to afford machine Z, it would be better off making no investment at all because if Z alone is invested in, another bottleneck appears too quickly for the initial investment cost to be recouped.
RATIOS
I want to finish off by briefly mentioning throughput ratios. There are three main ratios that are calculated: (1) return per factory hour, (2) cost per factory hour and (3) the throughput accounting ratio.
(1) Return per factory hour Throughput per unit/product time on bottleneck resource. As we saw in Example 1, the return per factory hour needs to be calculated for each product.
(2) Total factory costs/total time available on bottleneck resource. The ‘total factory cost’ is simply the ‘operational expense’ of the organisation referred to in the previous article. If the organisation was a service organisation, we would simply call it ‘total operational expense’ or something similar. The cost per factory hour is across the whole factory and therefore only needs to be calculated once.
(3) Return per factory hour/cost per factory hour. In any organisation, you would expect the throughput accounting ratio to be greater than 1. This means that the rate at which the organisation is generating cash from sales of this product is greater than the rate at which it is incurring costs. It follows on, then, that if the ratio is less than 1, this is not the case, and changes need to be made quickly.
CONCLUSION
At this point, I’m hopeful that you are now looking forward to reading The Goal as soon as possible and that you have a better understanding of the theory of constraints and throughput accounting, which you can put into practice by tackling some questions.
Written by a member of the Paper F5 examining team
Page: 1 2 See the original article>>


Copyright © 2000 - www.chinaacc.com All Rights Reserved. 北京正保会计科技有限公司 版权所有
京B2-20200959 京ICP备20012371号-7 出版物经营许可证 ![]() 京公网安备 11010802044457号
京公网安备 11010802044457号
套餐D大额券
¥
去使用
 新用户扫码下载